Image Details
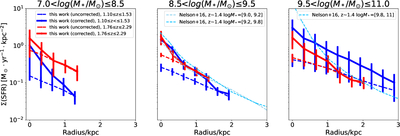
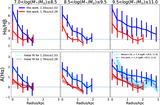
Caption: Figure 5.
Dust-corrected SFR radial profiles. The radial distribution of SFR measured directly by Hα is shown in dashed lines, and the blue and red solid lines represent SFR profiles corrected using the radial Balmer decrement curves for the two redshift bins, respectively. The light blue dashed lines show results of z ∼ 1.4 from E. J. Nelson et al. (2016b). The differences between dashed and solid lines imply the detection of previously dust-obscured star-forming regions.
Other Images in This Article
Copyright and Terms & Conditions
© 2026. The Author(s). Published by the American Astronomical Society.
Copyright ©
2026 Astronomy Image Explorer. All Rights Reserved.