Image Details
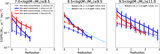
Caption: Figure 1.
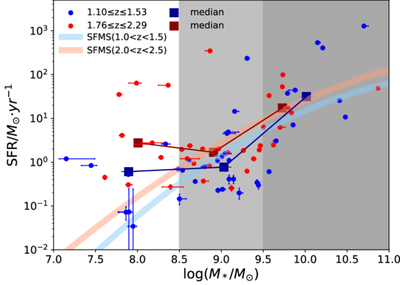
SFR and stellar mass (M*) for our galaxy samples, which are corrected for lensing magnification using the mass model of P. Bergamini et al. (2023). Blue and red dots correspond to the galaxies for the 1.10 ≤ z ≤ 1.53 and 1.76 ≤ z ≤ 2.29 samples, respectively. The stellar mass ranges adopted for stacking are denoted by the gray shaded regions, and medians for each bin are indicated by dark squares. The thick solid lines represent SFMS from K. E. Whitaker et al. (2014).
Other Images in This Article
Copyright and Terms & Conditions
© 2026. The Author(s). Published by the American Astronomical Society.
Copyright ©
2026 Astronomy Image Explorer. All Rights Reserved.