Image Details
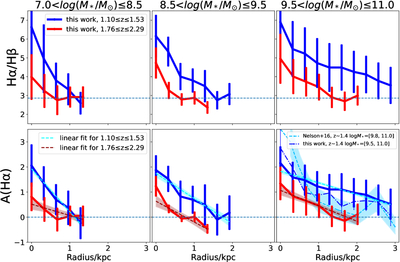
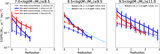
Caption: Figure 4.
Radial profiles of the Balmer decrement and the dust attenuation toward Hα emission. The blue and red lines represent galaxies at redshifts of 1.10 ≤ z ≤ 1.53 and 1.76 ≤ z ≤ 2.29, respectively. The top panels show the Hα/Hβ ratios with a dashed line at 2.86, and the bottom row shows dust attenuation toward Hα using the D. Calzetti et al. (2000) dust extinction law. In the bottom row, the light blue dashed line with error envelopes shows the result of z ∼ 1.4 from E. J. Nelson et al. (2016b).
Other Images in This Article
Copyright and Terms & Conditions
© 2026. The Author(s). Published by the American Astronomical Society.
Copyright ©
2026 Astronomy Image Explorer. All Rights Reserved.