Image Details
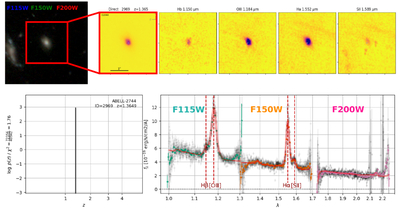
Caption: Figure 2.
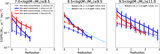
Example JWST/NIRISS data products for a galaxy (ID 02969) in the A2744 field. The top row shows the RGB thumbnail, F115W thumbnail, and emission-line maps, with observed wavelengths labeled. Each image spans 3″ × 3″ (∼25 kpc at z = 1.36) at ﹩0\mathop{.}\limits^{^{\prime\prime} }03﹩ per pixel. The bottom left panel shows the log p(z) plot, the unnormalized logarithm of the posterior redshift probability density, which is used to assess the relative likelihood of different redshift solutions, showing a sharp peak at z = 1.36 with a narrow redshift posterior uncertainty, indicating a well-constrained redshift solution. The bottom right panel shows the 1D NIRISS grism spectra covered in F115W, F150W, and F200W filters.
Other Images in This Article
Copyright and Terms & Conditions
© 2026. The Author(s). Published by the American Astronomical Society.