Image Details
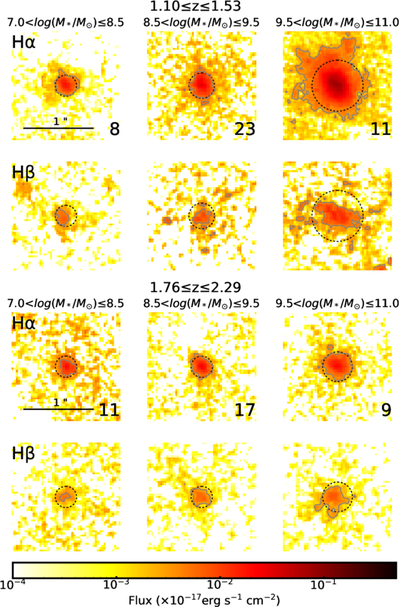
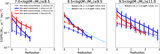
Caption: Figure 3.
Stacked Hα and Hβ surface brightness maps. Each composite image spans 50 × 50 pixels, with a spatial scale of 0﹩\mathop{.}\limits^{\unicode{x02033}}﹩03 per pixel. The number of galaxies included in each stack is indicated in the bottom-right corner of the corresponding Hα map. The gray line delineates the S/N = 2 boundary, while the dotted circles denote the radial range where the measurement uncertainty of the emission-line profile is less than half of the measured flux.
Other Images in This Article
Copyright and Terms & Conditions
© 2026. The Author(s). Published by the American Astronomical Society.
Copyright ©
2026 Astronomy Image Explorer. All Rights Reserved.