Image Details
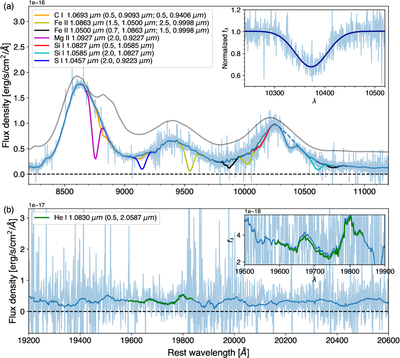
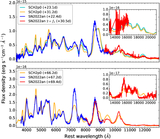
Caption: Figure 9.
Line identification of the absorption feature in the NIR spectrum of SN 2022an. The +55.4 day X-Shooter spectrum and its smoothed version are shown in blue, with the original data shown in a lighter shade. The synthetic spectrum of the SCH2p0 model at a phase of +58.9 days relative to B-band maximum from S. Blondin et al. (2018) is shown in gray for comparison. The absorption feature at around 1.037 μm is superposed on an emission feature attributed to S II (S. Blondin et al. 2018). The blue dashed line shows the equivalent pseudocontinuum, i.e., the estimated line profile of the underlying emission in the absence of the absorption feature. It is constructed by fitting the selected regions at 10240–10300 Å and 10450–10550 Å with a third-order polynomial. The inset in panel (a) shows the normalized spectrum (blue) of SN 2022an around the absorption feature along with its best-fit Gaussian profile (dark blue). Assuming that the detected absorption feature arises from a given ion, the expected absorptions from other transitions of that same ion (G. H. Marion et al. 2009) are shown as colored line segments. The legend labels have the format “Ion λ1(k2, λ2;k3, λ3;…),” where λ1 is the rest-frame wavelength of the transition of the given ion to account for the observed absorption, λ2,3,… are the rest-frame wavelengths of other transitions of the same ion, and k2,3,… are the corresponding ratios of the mock absorptions at λ2,3,... relative to the observed absorption at λ1. For example, if the observed absorption feature is identified as the Mg II 1.0927 μm line, then Mg II 0.9227 μm, with twice the strength, would cause the absorption shown by the magenta line. The inset in panel (b) shows a zoomed-in view around the expected He I 2.058 μm line.
Other Images in This Article
Show More
Copyright and Terms & Conditions
© 2026. The Author(s). Published by the American Astronomical Society.