Image Details
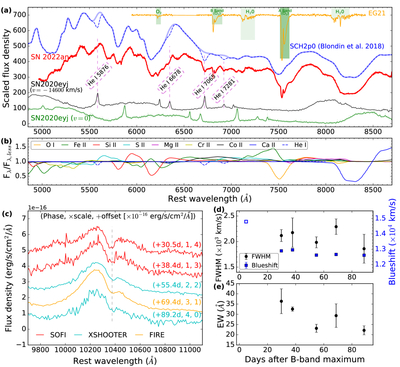
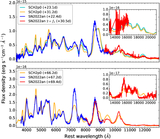
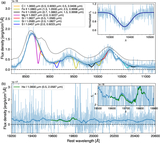
Caption: Figure 10.
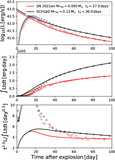
(a) He I absorption features in the optical spectrum of SN 2022an (red line), obtained with SOAR/GHTS at +5.3 days relative to B-band maximum. The blue vertical dashed lines denote the identified He I lines at λ5876, λ6678, λ7065, and λ7281. For comparison, spectra of SN 2020eyj, a SN Ia interacting with helium-rich CSM that exhibits He I emission (E. C. Kool et al. 2023), are shown in green (rest-frame) and black (blueshifted by 14,600 km s−1). Also shown is the synthetic spectrum from a sub-MCh explosion model (S. Blondin et al. 2018). The solid blue line represents the SCH2p0 model at +5.3 days, while the dashed blue line shows the same model after the addition of He I absorption features (see Section 4 for details). A telluric standard star (EG21) observed on the same night is plotted to indicate the locations of atmospheric absorption bands. (b) Ion contributions to the synthetic spectrum shown in panel (a). The spectra of individual ions, all except He I extracted from S. Blondin et al. (2018), are represented by the ratio of the full spectrum (Fλ) to the spectrum excluding bound–bound transitions of the corresponding ion (Fλ,less). Only ions that alter the flux by >10% within the wavelength range 5000–8500 Å are displayed. The He I mock spectrum is indicated by the dashed line. This comparison illustrates how line blending complicates the identification of individual ions. (c) Zoomed-in NIR spectra of SN 2022an centered on the He I 1.083 μm absorption feature (marked by the vertical dashed line). For clarity, the spectra have been scaled and vertically offset; the applied scaling factors, offsets, and phases relative to B-band maximum are indicated in parentheses. (d), (e) Measured properties of the He I 1.083 μm line. The FWHM and the blueshifted velocity of the absorption line are presented in panel (d), while the equivalent width (EW) is presented in panel (e). The velocity measured from the optical helium lines is added as an unfilled symbol.
Other Images in This Article
Show More
Copyright and Terms & Conditions
© 2026. The Author(s). Published by the American Astronomical Society.