Image Details
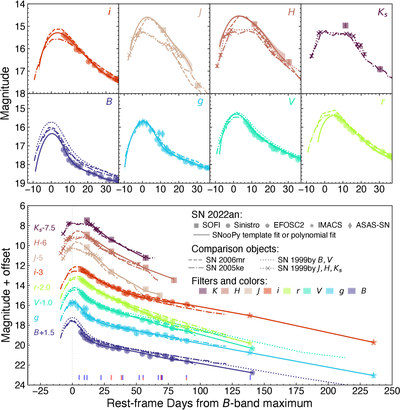
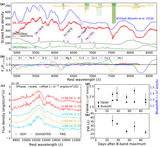
Caption: Figure 1.
Multiband light curves of SN 2022an and comparisons with other 91bg-like SNe Ia. The bottom panel shows the full range of the light curves, while the top panels show zoomed-in views around maximum light. All panels share the same color, symbol, and line-style scheme shown in the legend of the bottom panel: colors distinguish different filters, symbols indicate the instruments used for the SN 2022an photometry, and line styles distinguish different objects. In the top panels, the solid lines show the template-fitting results for the SN 2022an light curves obtained using the template-matching method implemented in SNooPy (C. R. Burns et al. 2011, 2014). In the bottom panel, the solid lines show polynomial fits to the SN 2022an light curves. Three low-luminosity 91bg-like SNe Ia, SN 1999by (P. Höflich et al. 2002; P. M. Garnavich et al. 2004), SN 2005ke (K. Krisciunas et al. 2017), and SN 2006mr (K. Krisciunas et al. 2017), are shown for comparison. The magnitudes of the reference objects have been shifted to match the distance of SN 2022an. The adopted distance moduli are ﹩{\mu }_{{\rm{SN}}{\rm{1999by}}}=30.75﹩ mag, ﹩{\mu }_{{\rm{SN}}{\rm{2005ke}}}=31.60﹩ mag, and ﹩{\mu }_{{\rm{SN}}{\rm{2006mr}}}=31.25﹩ mag, respectively. For SN 2006mr, an additional shift of −1 mag has been applied in all filters after correcting for the distance difference. Galactic extinction has been corrected for all objects; host-galaxy extinction has not. The epochs of the spectra listed in Table 4 are indicated as vertical lines along the bottom of the panel. Epochs of the optical spectra are shown in blue, while those of the NIR spectra are shown in red.
Other Images in This Article
Show More
Copyright and Terms & Conditions
© 2026. The Author(s). Published by the American Astronomical Society.