Image Details
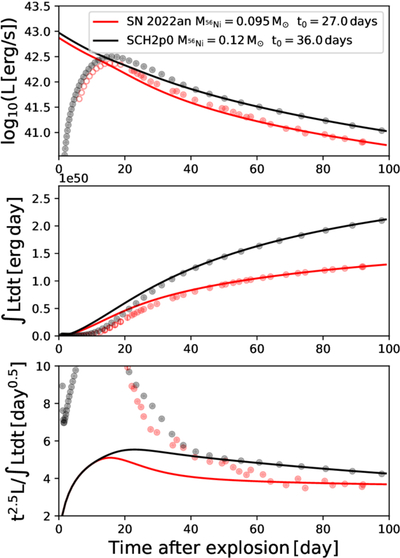
Caption: Figure 4.
The pseudobolometric light curve of SN 2022an (red) fit with the radioactive 56Ni decay model obtained using the method outlined in N. Wygoda et al. (2019). The synthetic light curve of the SCH2p0 model (black) from S. Blondin et al. (2018) is shown for comparison. The three panels show the pseudobolometric luminosity (top), the time-weighted integrated luminosity (middle), and the 56Ni-mass-independent quantity defined as the ratio of t2.5L/∫Ltdt (bottom). The Phase 1 data for SN 2022an are shown with unfilled symbols.
(The data used to create this figure are available in the online article.)
(The data used to create this figure are available.)
Other Images in This Article
Show More
Copyright and Terms & Conditions
© 2026. The Author(s). Published by the American Astronomical Society.