Image Details
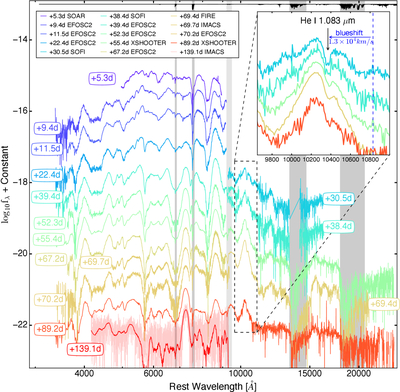
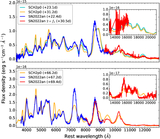
Caption: Figure 2.
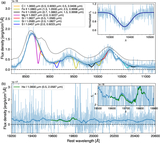
Optical and NIR spectra of SN 2022an. The phases of the spectra are given with respect to the time of B-band maximum, JD = 2459582. A telluric spectrum is shown at the top of the plot, and regions strongly affected by telluric absorption are marked with vertical gray bands. The inset panel shows a zoomed-in view of the detected absorption feature indicated by the black arrow, which, as discussed in the following sections, we attribute to the blueshifted He I line from its rest-frame wavelength of 1.083 μm (vertical dashed line).
Other Images in This Article
Show More
Copyright and Terms & Conditions
© 2026. The Author(s). Published by the American Astronomical Society.
Copyright ©
2026 Astronomy Image Explorer. All Rights Reserved.