Image Details
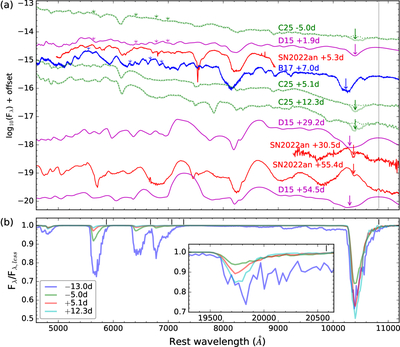
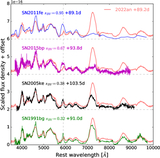
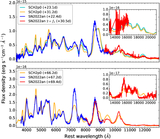
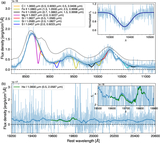
Caption: Figure 11.
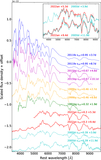
(a) Spectra of SN 2022an in red compared with model spectra from L. Dessart & D. J. Hillier (2015, D15) in magenta, A. Boyle et al. (2017, B17) in blue, and F. P. Callan et al. (2025, C25) in green. For C25, both the full model spectra and those computed without He I line opacity are plotted with solid and dotted lines, respectively. The phase of each spectrum, relative to the B-band peak in days, is labeled. The vertical black line indicates the rest-frame wavelength of the He I 1.083 μm line, while the corresponding observed absorption in SN 2022an and the synthetic features in the model spectra are marked by arrows. Absorption features corresponding to the He I λ5876, λ6678, λ7065, and λ7281 lines, which have the same blueshifted velocity as the 1.083 μm line, are indicated with short arrows in the model spectra for the earliest epochs of each category. (b) Normalized version of the C25 model spectra, i.e., the full model spectra divided by the corresponding spectra computed without the He line opacity. Different colors indicate different phases. The wavelength range around He I 2.058 μm is shown in the inset panel. The rest wavelengths of the He I lines are indicated by vertical black lines.
Other Images in This Article
Show More
Copyright and Terms & Conditions
© 2026. The Author(s). Published by the American Astronomical Society.