Image Details
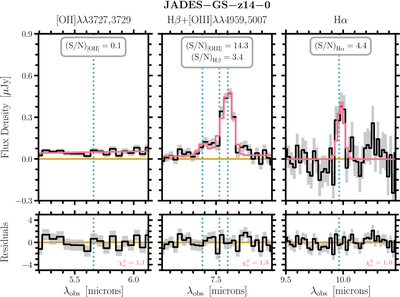
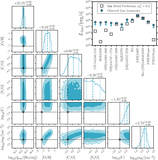
Caption: Figure 3.
Zoomed-in views around the strongest rest-frame optical emission lines. From left to right, we show the final MIRI/LRS 1D spectrum centered around [O II]λλ3727, 3729, Hβ + [O III]λλ4959, 5007, and Hα, respectively. Top panels: the best-fit continua and line profiles are shown in red along with the measured flux densities shown by the black lines and the flux uncertainties (1σ) shown by the gray shaded regions. Blue, vertical lines once again indicate the locations for some of the strongest emission lines. Bottom panels: the residuals of the best-fit models compared with the observations are shown by solid black lines and gray shaded regions. We report the reduced chi-squared statistics to demonstrate the quality of our fits.
Other Images in This Article
Copyright and Terms & Conditions
© 2026. The Author(s). Published by the American Astronomical Society.