Image Details
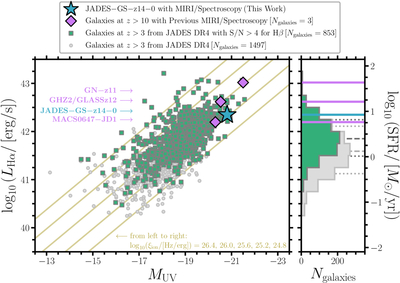
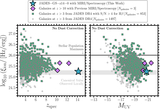
Caption: Figure 4.
Hα line luminosity versus absolute UV magnitude. Left panel: these measurements are shown for a few different samples of high-redshift star-forming galaxies at z > 3. These include N ≈ 1500 galaxies at z > 3 from the JADES DR4, represented by the gray circles, and N ≈ 850 of those same galaxies with Hβ well-detected at >4σ, represented by the green squares (E. Curtis-Lake et al. 2025; J. Scholtz et al. 2025b). For galaxies at z ≳ 6 in the JADES DR4, Hα has shifted beyond JWST/NIRSpec’s wavelength coverage, so we use the Hβ line luminosities instead and assume zero dust attenuation, consistent with Case B recombination. Three galaxies at z > 10 from the literature with previous MIRI/Spectroscopy are illustrated by the purple diamonds. These include, in order of decreasing brightness, GN-z11 at z = 10.60 (A. J. Bunker et al. 2023; J. Álvarez-Márquez et al. 2025), GHZ2/GLASSz12 at z = 12.34 (M. Castellano et al. 2024; J. A. Zavala et al. 2025), and MACS0647-JD1 at z = 10.17 (T. Y.-Y. Hsiao et al. 2024a, 2024b). Our measurements for JADES-GS-z14-0 at z = 14.18 are depicted by the blue star and represent the most distant detection of Hα. As a point of comparison, we provide brown lines to show the relation between LHα and MUV as parametrized by the ionizing photon production efficiency. Right panel: histograms showing the distributions of Hα line luminosities, which are used as a proxy for the recent star formation rate. Solid lines represent measurements for galaxies at z > 10 while gray dashed and dotted lines represent medians and 68% confidence intervals for the samples of galaxies at z > 3 from JADES DR4. JADES-GS-z14-0 is among the most actively star-forming galaxies at z > 3 with spectroscopic confirmation.
Other Images in This Article
Copyright and Terms & Conditions
© 2026. The Author(s). Published by the American Astronomical Society.