Image Details
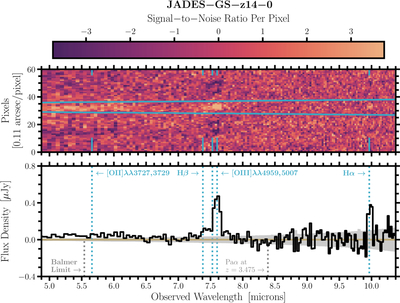
Caption: Figure 2.
The rest-frame optical spectrum of JADES-GS-z14-0. Top panel: the final MIRI/LRS 2D spectrum is provided. The corresponding color bar for the measured signal-to-noise ratio per pixel is also shown. JWST/MIRI’s detector plate scale is ﹩0\mathop{.}\limits^{\unicode{x02033}}11\,{{\rm{pixel}}}^{-1}﹩, as shown by the y-axis label. Blue, horizontal lines roughly indicate the wavelength-dependent profiles used for the 1D optimal extraction while the blue, vertical lines indicate the locations for some of the strongest rest-frame optical emission lines. Bottom panel: the final MIRI/LRS 1D spectrum is provided. There are two spectroscopic features that are clearly detected above the noise level (>4σ) in both the 2D and 1D spectra, in addition to the continuum, which is marginally detected (>1σ per wavelength bin at λobs ≲ 6 μm). The detection of these rest-frame optical emission lines and their scientific interpretation are the focus of this work, while the rest-frame optical continuum will be discussed and interpreted in a forthcoming manuscript (J. M. Helton et al. 2026, in preparation). The gray, vertical lines indicate the locations of the Balmer continuum limit for JADES-GS-z14-0 and the Paα line for the neighboring foreground galaxy at z = 3.475 (see also Figure 1). The final MIRI/LRS 2D and 1D spectra of JADES-GS-z14-0 are made available in the online journal.
(The data used to create this figure are available in the online article.)
(The data used to create this figure are available.)
Other Images in This Article
Copyright and Terms & Conditions
© 2026. The Author(s). Published by the American Astronomical Society.