Image Details
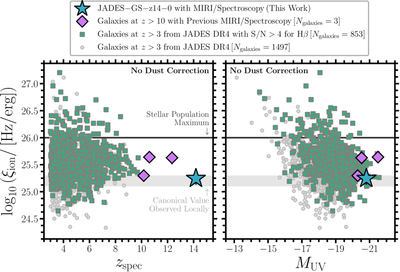
Caption: Figure 5.
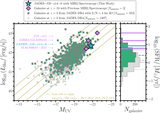
Ionizing photon production efficiency versus both spectroscopic redshift and absolute UV magnitude. Left panel: we show the same three samples of star-forming galaxies at z > 3 from Figure 4 using a consistent plotting scheme. For comparison, the canonical values that have been predicted and observed in galaxies at z ≲ 4 are shown by the gray shaded region (e.g., P. Madau et al. 1999; R. J. Bouwens et al. 2016) while the approximate stellar population maximum is shown by the black line (e.g., D. Schaerer et al. 2025). Among the four galaxies at z > 10 with these measurements, there are three that are similarly efficient at producing ionizing photons and include JADES-GS-z14-0, GHZ2/GLASSz12, and GN-z11. No dust corrections have been applied to these galaxies. The observed redshift evolution in the lower envelope of green points is caused by observational limitations and burstier SFHs at high redshifts, while the evolution in the upper envelope is caused by smaller dust reservoirs at high redshifts. Right panel: the faintest galaxies are observed as the most efficient producers of ionizing photons.
Other Images in This Article
Copyright and Terms & Conditions
© 2026. The Author(s). Published by the American Astronomical Society.