Image Details
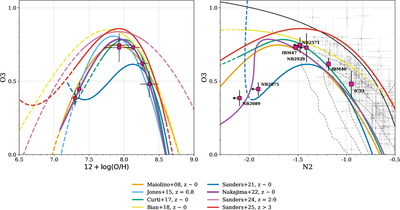
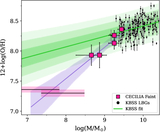
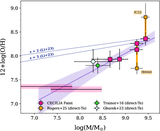
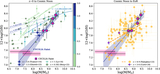
Caption: Figure 3.
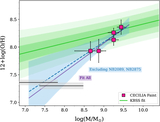
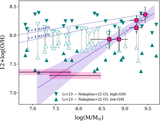
Left: O3 vs. ﹩12+\mathrm{log}({\rm{O}}/{\rm{H}})﹩ diagram with O3-based metallicity calibration curves, as indicated in the legend. While most calibrations agree at intermediate to high metallicities (﹩12+\mathrm{log}({\rm{O}}/{\rm{H}})\gtrsim 7.5﹩), they show substantial variation in O3 at fixed metallicity in the low-metallicity regime. We include the CECILIA Faint points (pink squares) based on their O3 measurements and inferred metallicities from the K. Nakajima et al. (2022) curve. Because the O3–metallicity relation is double-valued, we use N2 (right panel) as a branch discriminator (turnover at N2 ≈ −1.7). For galaxies with only upper limits in N2 that are consistent with both branches, we take the average of the two inferred metallicities and assign uncertainties that encompass the full possible range. Right: N2-BPT diagram (J. A. Baldwin et al. 1981) showing SDSS z ∼ 0 galaxies (gray contours), KBSS LBGs (A. L. Strom et al. 2017), and individual CECILIA Faint galaxies (pink squares; 2σ limits). The solid black line marks the AGN classification boundary from G. Kauffmann et al. (2003). Colored curves show metallicity calibrations for which both O3- and N2-based measurements are available at low and high redshift (the same as in the left panel, except for T. Jones et al. 2015 and R. L. Sanders et al. 2024). We adopt the K. Nakajima et al. (2022) calibration for this study, which best tracks our data in the N2-BPT space.
Other Images in This Article
Copyright and Terms & Conditions
© 2026. The Author(s). Published by the American Astronomical Society.