Image Details
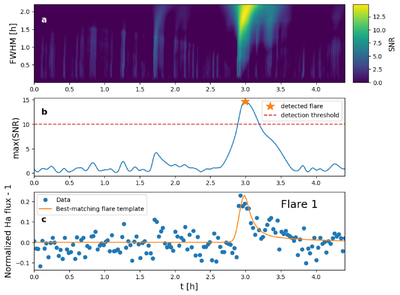
Caption: Figure 5.
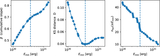
Matched-filter flare detection illustrated for Flare 1. (a) Two-dimensional matched-filter S/N map as a function of trial peak time t0 and template FWHM. (b) One-dimensional detection statistic obtained by maximizing the S/N over the FWHM at each t0 and then smoothing in time; the horizontal dashed line marks the adopted detection threshold (S/N = 10), and the star marks the detected peak. (c) Hα light curve around the detected event (points) together with the best-matching flare template (curve) corresponding to the peak in panel (b). This event occurs during a planetary transit. However, no explicit transit subtraction is applied in Hα, since stellar variability dominates at these wavelengths and cadences.
Other Images in This Article
Copyright and Terms & Conditions
© 2026. The Author(s). Published by the American Astronomical Society.