Image Details
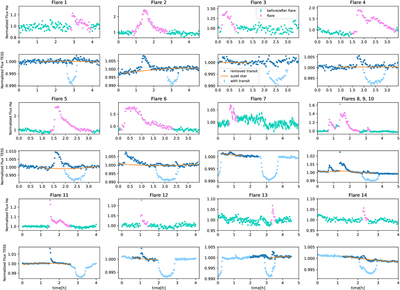
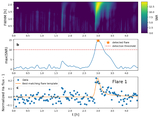
Caption: Figure 1.
Flares observed with JWST. Rows 1, 3, and 5 show the normalized Hα line-flux light curves used to define the flare windows (teal: points outside the flare window; magenta: points inside the flare window). Rows 2, 4, and 6 show the corresponding JWST-derived TESS-band light curves for the same events, including the data before transit removal (light blue), after transit removal (dark blue), and the low-order polynomial baseline adopted for the quiescent stellar flux during the flare (orange). Flares 1–6 were observed with NIRISS and Flares 7–14 with NIRSpec. All light curves are normalized to their median flux at nonflaring times.
Other Images in This Article
Copyright and Terms & Conditions
© 2026. The Author(s). Published by the American Astronomical Society.