

Image Details
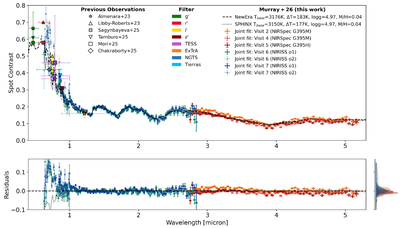
Caption: Figure 5.
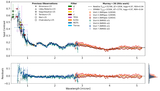
Top: the empirical spot contrast spectra for JWST Visits 2, 4, 5, 6, and 7. The contrast uncertainties are those derived directly from the spectroscopic fits in Section 3.2.3. The dashed black line shows the best-fit NewEra model (Tbase = 3176 ± 10 K, Tspot = 2993 ± 10 K) and the dotted line shows the best-fit SPHINX model (Tbase = 3150 ± 13 K, Tspot = 2972 ± 13 K). We overplot broadband contrasts derived in previous works by J. M. Almenara et al. (2022), J. E. Libby-Roberts et al. (2023), P. Tamburo et al. (2025), M. Mori et al. (2025), S. Sagynbayeva et al. (2025), and H. Chakraborty et al. (2025) (compiled in Table 4). Bottom: residuals between the spectroscopic contrasts and the best-fit NewEra model. The difference between the SPHINX and NewEra models is shown with the dotted black line. A histogram of the residuals for each visit is shown to the right of the residual plot. The JWST spectra shown in the top plot are available as the data behind the figure in machine-readable format.
(The data used to create this figure are available in the online article.)
(The data used to create this figure are available.)
Other Images in This Article
Copyright and Terms & Conditions
© 2026. The Author(s). Published by the American Astronomical Society.

