

Image Details
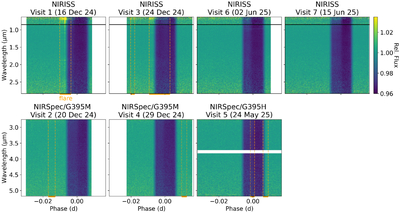
Caption: Figure 1.
Spectroscopic time series of the transit light curves of TOI-3884 b for all seven JWST visits, reduced with ExoTEDRF (Section 2.2). NIRISS/SOSS observations are presented in the top row, and NIRSpec/BOTS in the bottom. Each panel shows normalized flux as a function of orbital phase and wavelength, and the color scale is shared across all panels. In all visits, the planetary transit appears as a broad vertical band centered at phase zero, and the spot-crossing event is apparent in the first half of the transit. Several visits also exhibit continuum and line emission attributable to stellar flares. The horizontal black lines (0.85 μm) on the top panels indicate approximately where NIRISS orders 1 and 2 overlap (0.85–1.10 μm). The white horizontal bar in Visit 5 indicates the gap between the NRS1 and NRS2 detectors for the G395H mode (3.72–3.82 μm); in the G395M mode, only NRS1 is illuminated. The timings of identified flares are marked in orange on the x-axes.
Other Images in This Article
Copyright and Terms & Conditions
© 2026. The Author(s). Published by the American Astronomical Society.

