

Image Details
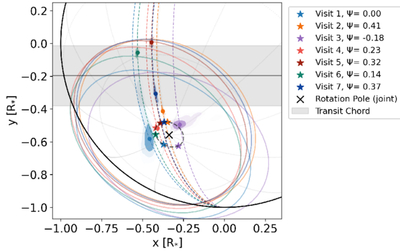
Caption: Figure 3.
The best-fit TOI-3884 spot centers for the individual white light-curve fits (Section 3.3, solid circles with contours indicating the 1σ and 2σ regions from the posteriors) and the joint white light-curve fit (Section 3.2, stars). We plot ellipses indicating the extent of each spot from the self-consistent joint model. We find the best-fit solutions for Visits 5 and 6 have a spot above the transit chord (shaded gray), likely due to the geometric symmetry about the transit chord and the known radius–latitude degeneracy. Therefore, for those two visits, we also include the lines of projected “longitude” along which we might expect to find degenerate spots (dotted colored lines). The black cross marks the stellar rotation pole (i* = 139﹩\mathop{.}\limits^{\unicode{x000b0}}﹩2, λ* = 31﹩\mathop{.}\limits^{\unicode{x000b0}}﹩1) derived in the self-consistent joint model, and the dashed black line indicates how the center of the spot rotates around the pole. The stellar rotation phase, Ψ, for each visit is shown in the legend (assuming Ψ = 0 at the first visit). This plot is inspired by Figure 3 from H. Chakraborty et al. (2025).
Other Images in This Article
Copyright and Terms & Conditions
© 2026. The Author(s). Published by the American Astronomical Society.

