

Image Details
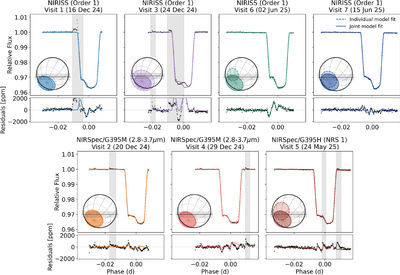
Caption: Figure 2.
White-light transit light curves of TOI-3884 b for all seven JWST visits using the ExoTEDRF reduction described in Section 2.2. NIRISS/SOSS observations are presented in the top row, and NIRSpec/BOTS (λ = 2.8–3.7 μm to match G395H NRS1) in the bottom. For each visit, the upper panel shows the normalized flux as a function of transit phase as well as the best-fitting white-light models for each visit independently (Section 3.3, dashed lines), and for the joint fit excluding Visit 3 (Section 3.2, solid lines). We plot how the respective individual and joint spot fits for each visit would look on TOI-3884 in each panel. The lower panels show the corresponding flux residuals for the joint model with black points (data point uncertainties are plotted but are almost negligible compared to the residual structure), and the difference between the individual and joint models with the colored lines. For some visits, modeling the light curve individually reduces residuals (e.g., Visit 6); however, most visits show significant structure regardless of the fitting method used. All visits exhibit a pronounced spot-crossing feature during the first half of the transit, though its shape clearly varies between visits. Stellar flares, marked by shaded gray regions, are evident in most light curves. Visits 1 and 3, in particular, show strong stellar flares that overlap the transit window. The NIRSpec observations, which probe longer wavelengths, show comparatively quiescent behavior, though flares are still present in all NIRSpec datasets.
Other Images in This Article
Copyright and Terms & Conditions
© 2026. The Author(s). Published by the American Astronomical Society.

