

Image Details
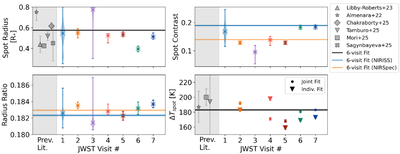
Caption: Figure 4.
Best-fit TOI-3884 spot radii (top left), instrument-dependent contrasts (upper right), and planet-to-star radius ratios (lower left) from each individual white light-curve fit. The best-fit spot radius, contrasts, and radius ratios from the self-consistent joint model are indicated with horizontal lines. Visits 1 and 3 are significantly impacted by stellar flares, therefore are heavily masked, inflating the uncertainties of the derived parameters for these visits. The best-fit spot temperature for Visits 2, 4, 5, 6, and 7 are shown on the bottom right plot. For comparison, we include literature values for the wavelength-independent spot radius and temperature (187 ± 21 K, J. M. Almenara et al. 2022; 194 ± 72 K, P. Tamburo et al. 2025; and 200 ± 11 K, M. Mori et al. 2025). We note that J. E. Libby-Roberts et al. 2023 report a large temperature range (ΔT ≈ 300–500 K) out of plot range, while H. Chakraborty et al. (2025) and S. Sagynbayeva et al. (2025) do not quote temperatures.
Other Images in This Article
Copyright and Terms & Conditions
© 2026. The Author(s). Published by the American Astronomical Society.

