Image Details
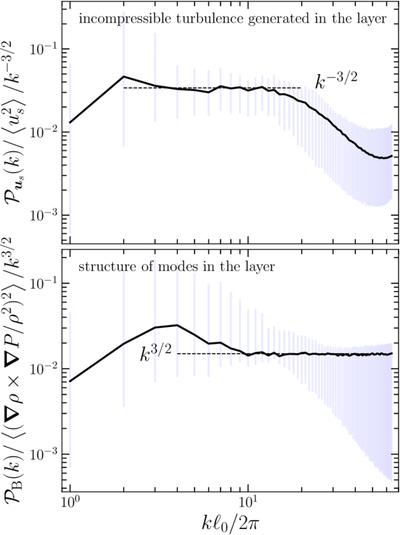
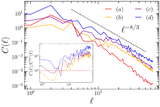
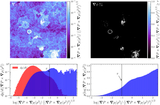
Caption: Figure 3.
Top: the incompressible velocity-mode spectrum, ﹩{{ \mathcal P }}_{{{\boldsymbol{u}}}_{s}}(k)﹩, averaged (black) over the ensemble of localized SNRs and normalized by both the integral of the spectrum and a k−3/2 compensation. The ensemble 1σ is shown in transparent blue. The wavenumber is normalized to ℓ0 = 125 pc, the domain size of the region extracted around each SNR. The plot shows the development of a self-similar range of modes that already exhibit a ﹩{{ \mathcal P }}_{{{\boldsymbol{u}}}_{s}}(k)\propto {k}^{-3/2}﹩ spectrum on the scales of individual SNRs. This is the same spectrum found in global disk cutout simulations of SN-driven turbulence (P. Padoan et al. 2016; J. R. Beattie et al. 2025c; I. Connor et al. 2026). Bottom: the pure baroclinic power spectrum, ﹩{{ \mathcal P }}_{B}(k)﹩ (Equation (4)), normalized in the same way as the top panel but with a k3/2 compensation. This spectrum probes the organization of Fourier modes in the fractal layer between the warm and hot plasma in the SNR. It exhibits a ﹩{{ \mathcal P }}_{B}(k)\propto {k}^{3/2}﹩ power law, peaking at high k, reflecting the signature of a highly folded layer structure with strong gradients on very small scales (A. A. Schekochihin et al. 2004).
Other Images in This Article
Show More
Copyright and Terms & Conditions
© 2026. The Author(s). Published by the American Astronomical Society.