Image Details
Caption: Figure 2.
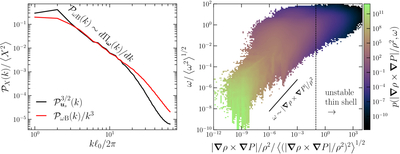
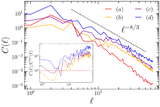
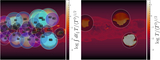
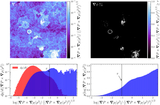
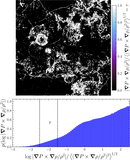
Left: the vorticity–baroclinic power (co)spectrum, ﹩{{ \mathcal P }}_{\omega B}(k)﹩ (Equation (2)), and the incompressible velocity-mode power spectrum, ﹩{{ \mathcal P }}_{{{\boldsymbol{u}}}_{s}}(k)﹩ (Equation (1)), averaged over ≈100 SNRs and normalized to test Equation (7). Because the two transformed spectra scale with each other almost perfectly, the enstrophy sourced by baroclinicity, ﹩{{ \mathcal P }}_{\omega B}﹩, fully accounts for the enstrophy flux entering the cascade, dΠω/dk. This demonstrates that the low-volume, fractal layer, which dominates the baroclinicity (see Appendix B for a more detailed calculation showing that the unstable layer alone provides between all and 70% of the baroclinicity in the global simulations), drives the incompressible turbulence across a broad band of modes. Right: the 2D volume-weighted pdf of vorticity and baroclinicity, showing a strong positive correlation, ω ∼ ∣∇ρ × ∇P/ρ2∣, that peaks and flattens at the ∇ρ × ∇P/ρ2 values concentrated within the fractal layer (see Figure 1). This shows that volume-poor layers can dominate the baroclinic production.
Other Images in This Article
Show More
Copyright and Terms & Conditions
© 2026. The Author(s). Published by the American Astronomical Society.