Image Details
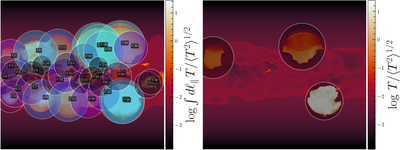
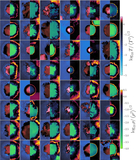
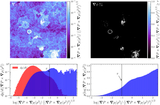
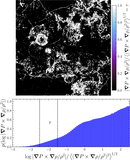
Caption: Figure 6.
Identified SNRs in disk cutout simulations. Left: an example showing 33 SNRs identified at early times in the simulations from J. R. Beattie et al. (2025c). The background field is the logarithmic LOS temperature, normalized by the rms temperature of the full domain. Each label marks the projected geometric center of an SNR, which I use to extract a surrounding 1283-cell region for the local analysis presented in the main text. Right: the same as the left panel, but for the a slice through the middle of the out-of-page axis.
Other Images in This Article
Show More
Copyright and Terms & Conditions
© 2026. The Author(s). Published by the American Astronomical Society.
Copyright ©
2026 Astronomy Image Explorer. All Rights Reserved.