Image Details
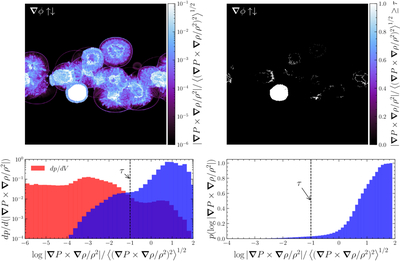
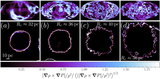
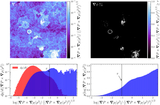
Caption: Figure 8.
Global baroclinicity statistics at the onset of SN-driven turbulence. Top left: slice of ∣∇ρ × ∇P/ρ2∣, normalized by the volume-integrated rms value, shown in a plane parallel to the gravitational potential gradient, ∇ϕ. Bottom left: the ∣∇ρ × ∇P/ρ2∣-weighted (blue) and volume-weighted (red) pdf's of ﹩\mathrm{log}| {\boldsymbol{\nabla }}\rho \times {\boldsymbol{\nabla }}P/{\rho }^{2}| ﹩. These demonstrate that baroclinic generation is concentrated in the high-∣∇ρ × ∇P/ρ2∣, low-volume tail of the volume-weighted distribution. A threshold ﹩\tau =0.1\,{\langle {({\boldsymbol{\nabla }}\rho \times {\boldsymbol{\nabla }}P/{\rho }^{2})}^{2}\rangle }^{1/2}﹩ is indicated as the approximate point where the ∣∇ρ × ∇P/ρ2∣-weighted pdf begins to rise. Top right: same slice as in the top left panel, but retaining only regions with ∣∇ρ × ∇P/ρ2∣ > τ, highlighting the structures responsible for the majority of baroclinic production. As discussed here and in J. R. Beattie et al. (2025c), these correspond to the unstable thin shells that form near the cooling radius of SNRs (the unstable contact discontinuity). Bottom right: CDF of ∣∇ρ × ∇P/ρ2∣, showing that ∂t∣ω∣ ∝ ∣∇ρ × ∇P/ρ2∣ is overwhelmingly dominated by regions with ﹩| {\boldsymbol{\nabla }}\rho \times {\boldsymbol{\nabla }}P/{\rho }^{2}| /{\langle {({\boldsymbol{\nabla }}\rho \times {\boldsymbol{\nabla }}P/{\rho }^{2})}^{2}\rangle }^{1/2}\gt \tau ﹩, i.e., the high-baroclinicity structures isolated in the top right panel.
Other Images in This Article
Show More
Copyright and Terms & Conditions
© 2026. The Author(s). Published by the American Astronomical Society.