

Image Details
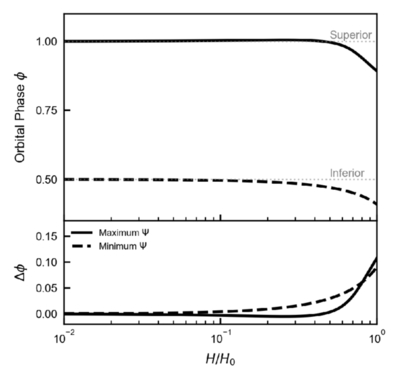
Caption: Figure C1.
Upper panel: evolution of the orbital phases corresponding to the maximum (solid line) and minimum (dashed line) EC scattering efficiency as functions of H/H0. The horizontal dotted lines mark the superior and inferior conjunction phases. Lower panel: phase offsets of the EC extrema relative to the conjunctions. The solid curve shows ﹩{\rm{\Delta }}\phi =1.0-{\phi }_{{\rm{\max }}}﹩, and the dashed curve shows ﹩{\rm{\Delta }}\phi =0.5-{\phi }_{{\rm{\min }}}﹩. As the emission zone moves inward (H/H0 ≪ 1), both offsets approach zero, indicating that a compact inner emitter naturally peaks closer to the conjunction phases.
Other Images in This Article
Copyright and Terms & Conditions
© 2026. The Author(s). Published by the American Astronomical Society.

