

Image Details
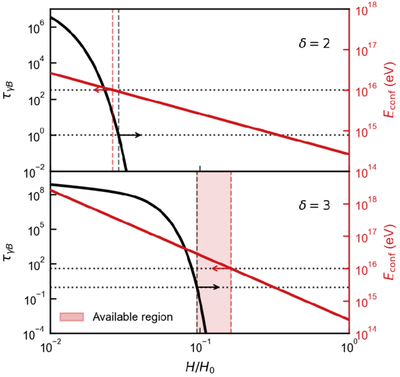
Caption: Figure 4.
Constraints on the PeV emission zone for Point B in Figure 3, i.e., the 3σ solution that yields the global minimum decay index. The two panels show the results for δ = 2 and 3, respectively. The black curves represent the magnetic pair-production optical depth τγB, and the red curves represent the confinement energy Econf. The horizontal dotted lines mark τγB = 1 and the most conservative threshold Econf = 10 PeV. The shaded region shows where both conditions are satisfied simultaneously.
Other Images in This Article
Copyright and Terms & Conditions
© 2026. The Author(s). Published by the American Astronomical Society.

Copyright ©
2026 Astronomy Image Explorer. All Rights Reserved.
