

Image Details
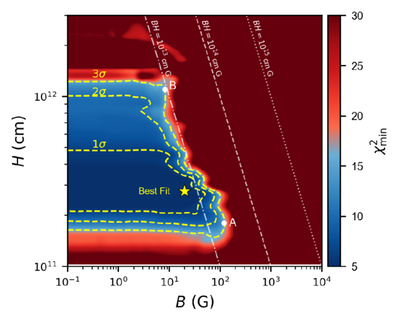
Caption: Figure 3.
Minimum-χ2 map in the (B, H) plane. The dashed contours mark the 1σ, 2σ, and 3σ confidence regions defined by the corresponding Δχ2 thresholds for two parameters of interest. The white dot-dashed, dashed, and dotted lines show constant (BH) values of (10^{13}), (10^{14}), and (10^{15}\ {\rm G,cm}), respectively. Point A denotes the largest-BH solution formally enclosed by the 3σ contour, while Point B marks the 3σ solution that yields the global minimum decay index required to satisfy both τγB < 1 and robust threshold Econf ≥ 10 PeV.
Other Images in This Article
Copyright and Terms & Conditions
© 2026. The Author(s). Published by the American Astronomical Society.

Copyright ©
2026 Astronomy Image Explorer. All Rights Reserved.
