

Image Details
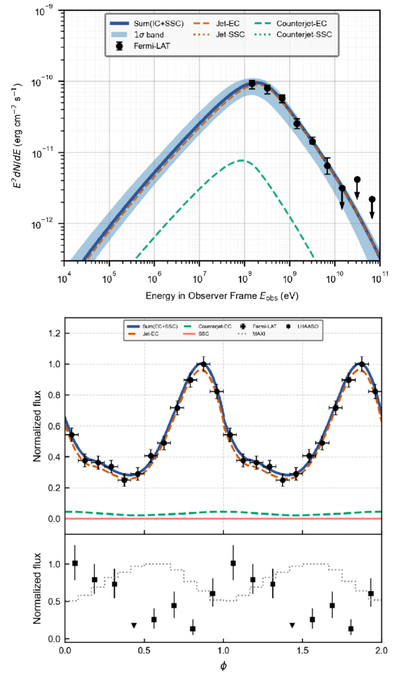
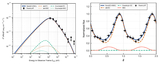
Caption: Figure 2.
Broadband modeling of Cygnus X-3 during the LHAASO PeV epoch. Upper panel: Fermi-LAT spectral energy distribution. Black circles and arrows denote measured fluxes and upper limits. The solid blue curve shows the total best-fit model, composed of EC emission from the jet (orange dashed) and counterjet (green dashed). The light blue shaded band marks the 1σ uncertainty range of the modeled spectrum. Middle panel: normalized Fermi-LAT orbital light curve in the 0.1–100 GeV band . The black circles show the Fermi-LAT data used in the fit. Bottom panel: normalized LHAASO (≥0.1 PeV; black squares, with downward triangles indicating upper limits) and MAXI (2–20 keV; gray dotted curve) orbital light curves, shown for comparison of their relative phase behavior. Two orbital periods are shown in the middle and bottom panels to visualize the phase continuity.
Other Images in This Article
Copyright and Terms & Conditions
© 2026. The Author(s). Published by the American Astronomical Society.

