Image Details
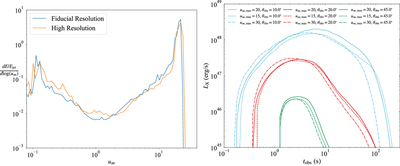
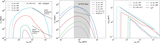
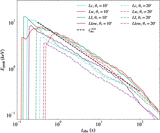
Caption: Figure A1.
Left panel: the energy distribution per logarithm of the terminal four-velocity. The blue line shows the Lc model at the fiducial resolution, while the orange line shows the same model at higher resolution. Both distributions are computed at tlab = 40 s when the jet head is reaching ∼10R⋆. Right panel: EP WXT X-ray lightcurves. The solid lines are the fiducial lightcurves with ﹩{u}_{\infty ,{\rm{\max }}}=20﹩ in the Lc model that we show in the left panel of Figure 4. The dashed lines and dashed–dotted lines are lightcurves of the Lc models with ﹩{u}_{\infty ,{\rm{\max }}}=15﹩ and ﹩{u}_{\infty ,{\rm{\max }}}=30﹩, respectively. Colors indicate different viewing angles, as in the left panel of Figure 4.
Other Images in This Article
Show More
Copyright and Terms & Conditions
© 2026. The Author(s). Published by the American Astronomical Society.