Image Details
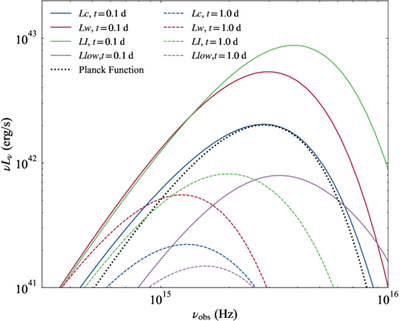
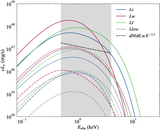
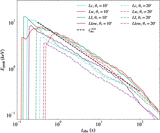
Caption: Figure 12.
Time-resolved spectra at late times. The solid lines are spectra at 0.1 days, and the dashed lines show the spectra at 1 day. Colors represent different models, as in Figure 5. The black dashed line is the Planck function with T = 35,000 K. The observed spectra are quasi-thermal but slightly broader than the Planck function. All models shown are for θv = 45°.
Other Images in This Article
Show More
Copyright and Terms & Conditions
© 2026. The Author(s). Published by the American Astronomical Society.
Copyright ©
2026 Astronomy Image Explorer. All Rights Reserved.