Image Details
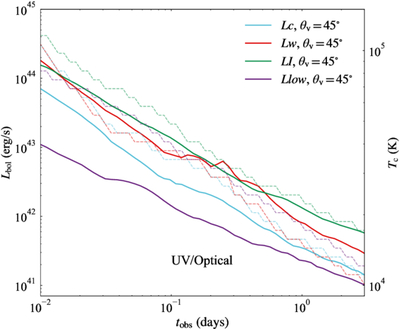
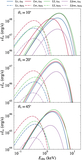
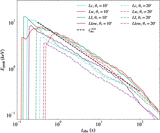
Caption: Figure 11.
Late-time bolometric lightcurves (left axis) for different models viewed at θv = 45°. Colors represent different models, as in Figure 4. The dashed lines are the corresponding color temperatures (right axis).
Other Images in This Article
Show More
Copyright and Terms & Conditions
© 2026. The Author(s). Published by the American Astronomical Society.
Copyright ©
2026 Astronomy Image Explorer. All Rights Reserved.