Image Details
Caption: Figure 4.
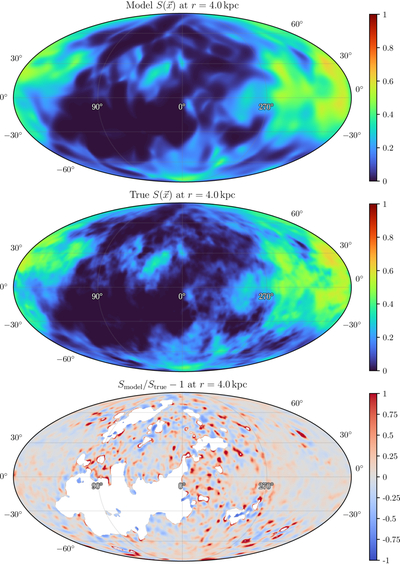
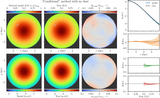
Sky plots of the “selection function” method’s prediction of the selection function S(x), the true selection function, and their fractional residuals on the surface of a sphere of radius 4 kpc, centered on the mock observer. Areas with Strue < 0.01 are masked. The differences can be attributed to shot noise in areas of low completeness and to the difficulty of capturing fine angular structure with a neural network. Nevertheless, with a mock selection function with structure down to ∼0.25 kpc scales, our selection function implementation performs well, albeit at the cost of large model sizes (here, ∼1.4 million parameters).
Other Images in This Article
Copyright and Terms & Conditions
© 2026. The Author(s). Published by the American Astronomical Society.