Image Details
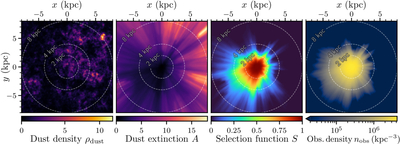
Caption: Figure 1.
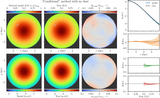
Two-dimensional slices (the z = 0 plane) through the three-dimensional dust extinction density (left) and integrated extinction (as viewed from the origin; middle left), the resulting selection function (middle right), and the expected observed spatial distribution of stars (right). The right panel shows the smooth expected density; the mock dataset used in this work is a single realization of this distribution. The observer is assumed to be at the origin. Dust extinction imprints fine angular structure on the selection function and the observed spatial distribution of stars, which can be difficult to capture with neural networks.
Other Images in This Article
Copyright and Terms & Conditions
© 2026. The Author(s). Published by the American Astronomical Society.