Image Details
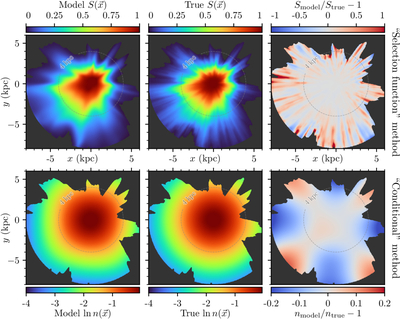
Caption: Figure 3.
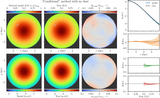
Recovery of the selection function and true spatial density of tracers by the “selection function” and “conditional” methods, respectively, in a two-dimensional slice through the x−y plane (at z = 0). Top row: the recovered selection function (left), true selection function (middle), and residuals (right) for the “selection function” method. Bottom row: the recovered true spatial density of tracers (left), true spatial density of tracers (middle), and residuals (right) for the “conditional” method. Dust imprints fine angular structure on the selection function, necessitating much larger models (∼1.4 million parameters in this case) than are needed to capture the much smoother true spatial density of tracers (∼47,000 parameters). As seen in the top right panel, the selection function residuals appear as long radial spurs, illustrating the difficulty of recovering the angular structures in ﹩S\left({\boldsymbol{x}}\right)﹩.
Other Images in This Article
Copyright and Terms & Conditions
© 2026. The Author(s). Published by the American Astronomical Society.