Image Details
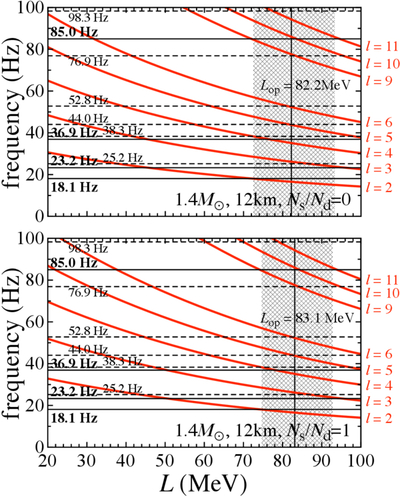
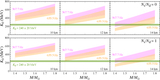
Caption: Figure 1.
The rest-frame frequencies, ν0, listed in Table 1 (except for 205.6 Hz) identified with the fundamental frequencies of crustal torsional oscillations with various values of ℓ, for the NS model with 1.4⊙ and 12 km. The top and bottom panels correspond to the results with Ns/Nd = 0 and 1, respectively. The horizontal solid lines with the QPO frequencies written in bold font are frequencies with statistical significance greater than or equal to 3σ, while the dashed lines with the QPO frequencies written in thin font are those with significance less than 3σ. The vertical lines denote the optimal value of L (denoted by Lop) to identify the QPO frequencies with the fundamental frequencies of the crustal torsional oscillations, while the shaded regions denote Lop ± 1σ.
Other Images in This Article
Copyright and Terms & Conditions
© 2026. The Author(s). Published by the American Astronomical Society.