Image Details
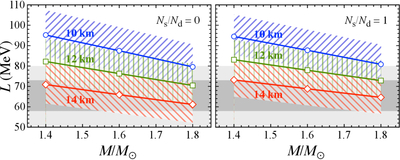
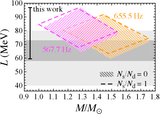
Caption: Figure 2.
The optimal ranges of Lop ± 1σ to identify the observed QPO frequencies with the crustal torsional oscillations, shown for various NS models. The gray shaded regions denote the range of fiducial value of L, i.e., L = 60 ± 20 MeV in light gray (M. B. Tsang et al. 2012; W. G. Newton et al. 2014; B.-A. Li et al. 2019), and the range of L constrained from the identification of magnetar QPOs observed in SGR 1806-20 with crustal torsional oscillations, i.e., L = 58–73 MeV in dark gray (H. Sotani et al. 2018; H. Sotani 2024).
Other Images in This Article
Copyright and Terms & Conditions
© 2026. The Author(s). Published by the American Astronomical Society.
Copyright ©
2026 Astronomy Image Explorer. All Rights Reserved.