Image Details
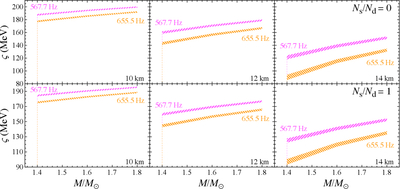
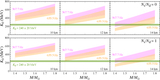
Caption: Figure 4.
Constraints on the parameter ς, obtained by identifying the QPO frequencies of ∼600 Hz with the first overtone of crustal torsional oscillations. The left, middle, and right panels correspond to stellar models whose radii are 10, 12, and 14 km, respectively, while the top and bottom panels correspond to results with Ns/Nd = 0 and 1. In each panel, the lower and upper bounds come from the upper and lower bounds of the uncertainties in the QPO frequency (see Figure 3).
Other Images in This Article
Copyright and Terms & Conditions
© 2026. The Author(s). Published by the American Astronomical Society.
Copyright ©
2026 Astronomy Image Explorer. All Rights Reserved.