Image Details
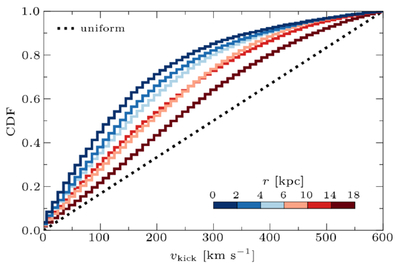
Caption: Figure B1.
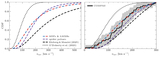
Kick velocity distribution of simulated objects older than 40 Myr for several distance ranges (colors), similar to Figure 2 but through a simulation using birth locations as described in Appendix B. The dotted line shows a uniform distribution.
Other Images in This Article
Copyright and Terms & Conditions
© 2026. The Author(s). Published by the American Astronomical Society.
Copyright ©
2026 Astronomy Image Explorer. All Rights Reserved.