Image Details
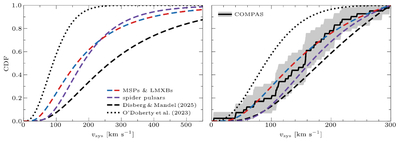
Caption: Figure 4.
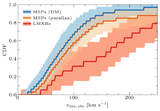
Systemic kick distributions fitted to the observations while accounting for the kinematic bias. The left panel shows these lognormal distributions for the MSPs and LMXBs (μ = 5.1 and σ = 0.7, blue-and-red dashed line), as well as for the spider pulsars (μ = 5.2 and σ = 0.5, purple dashed line). The dashed line shows the natal NS kick distribution of P. Disberg & I. Mandel (2025), fitted to isolated pulsar velocities, while the dotted line shows the fit of T. N. O’Doherty et al. (2023) to their observed systemic kick estimates of MSPs, spiders, and LMXBs (as shown in Figure 3). The right panel shows the same distributions, but normalized between 0 and 300 km s−1. The shaded region is the 95% bootstrapped interval of COMPAS binaries with Porb ≤ 10 days and Mc ≤ 1 M⊙ (as discussed in Section 5).
Other Images in This Article
Copyright and Terms & Conditions
© 2026. The Author(s). Published by the American Astronomical Society.