Image Details
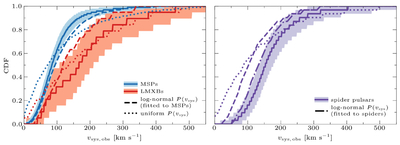
Caption: Figure 3.
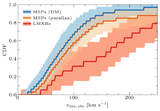
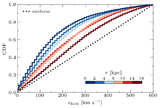
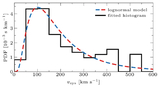
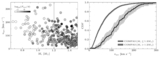
Observed systemic kick distributions of T. N. O’Doherty et al. (2023) for MSPs (blue), LMXBs (red), and spider pulsars (purple). The solid lines show the median distributions, and the shaded regions correspond to the 90% confidence intervals. The dashed lines are determined through Equations (3) and (4) and a lognormal P(vsys) distribution fitted to the lower edge of the MSP confidence interval. The dashed–dotted line, in turn, uses a P(vsys) distribution fitted to the upper edge of the spider pulsars’ confidence interval. The dotted line shows the kinematic bias for a uniformly distributed P(vsys).
Other Images in This Article
Copyright and Terms & Conditions
© 2026. The Author(s). Published by the American Astronomical Society.
Copyright ©
2026 Astronomy Image Explorer. All Rights Reserved.