Image Details
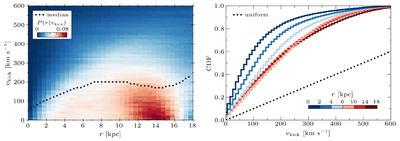
Caption: Figure 2.
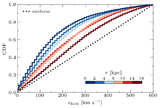
Distances of the kicked objects in the simulation of P. Disberg et al. (2025) for 40 Myr < t < 1 Gyr (evaluated with time steps of 1 Myr). The left panel shows, for each simulation containing 103 objects with a kick magnitude vkick, the distribution of distances to the Sun (r) in a 2D histogram with distance bins of 0.5 kpc and velocity bins of 10 km s−1. The rows are normalized so that the distribution corresponds to P(r∣vkick). The dotted line shows the median kick velocity in each distance bin. The right panel shows kick distributions integrated over certain distance ranges (colors) through Equation (1) for a uniform kick distribution between 0 and 1000 km s−1, along with that uniform distribution itself (dotted line), which is the kick distribution observed at t = 0 for any distance. We note that (1) the simulation considers kick velocities up to 1000 km s−1, even though the figure shows kicks up to 600 km s−1, and (2) vkick equals the natal kick for single objects but the systemic kick for binaries.
Other Images in This Article
Copyright and Terms & Conditions
© 2026. The Author(s). Published by the American Astronomical Society.