Image Details
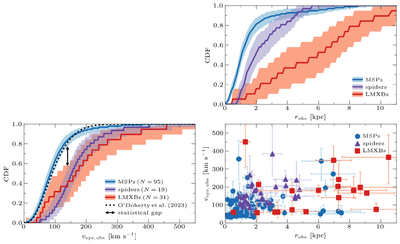
Caption: Figure 1.
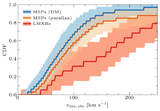
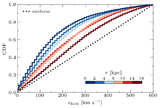
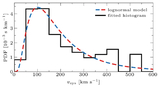
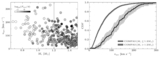
Observed distributions of systemic kicks (bottom left panel) and distances (top right panel) for the MSPs (blue), spiders (purple) and LMXBs (red) in the samples of T. N. O’Doherty et al. (2023). The dark lines show the median distributions, and the shaded regions correspond to the bootstrapped 90% confidence intervals. The dotted line shows the fitted beta distribution of T. N. O’Doherty et al. (2023), which is dominated by the MSPs, and the black double-headed arrow illustrates the statistical gap between the MSPs and the other objects. The bottom right panel shows the relationship between the distances and systemic kicks for the MSPs (blue circles), spider pulsars (purple triangles), and LMXBs (red squares), where the error bars show the 68% confidence intervals.
Other Images in This Article
Copyright and Terms & Conditions
© 2026. The Author(s). Published by the American Astronomical Society.