Image Details
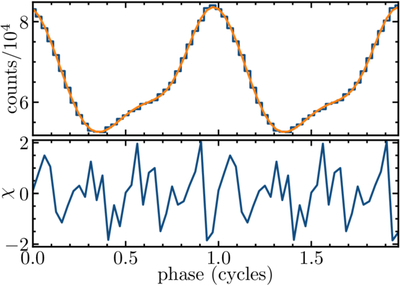
Caption: Figure 4.
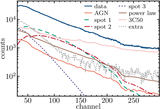
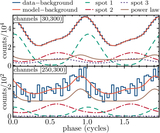
Top: comparison between the bolometric data (histogram) and the best model with three uniform-temperature circular spots plus a modulated power law (red line). Bottom: residuals between the data and the best model. Here, we plot two full rotational cycles, with 32 uniformly distributed rotational phases per cycle. In addition to the overall adequate bolometric χ2/dof = 33.39/27 (18% probability if the model is correct), we see no strong outliers and no obvious patterns in the residuals. As with the phase-channel χ, this is a one-way test, which might detect a strong deviation between the model and the data but cannot guarantee the model’s correctness if it passes the test.
Other Images in This Article
Show More
Copyright and Terms & Conditions
© 2026. The Author(s). Published by the American Astronomical Society.