Image Details
Caption: Figure 12.
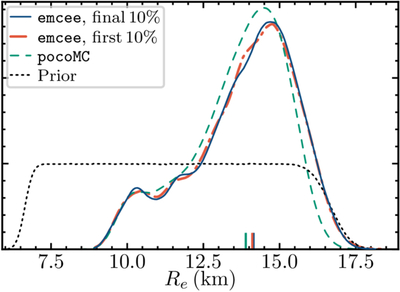
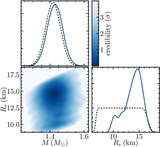
Comparison of several probability distributions for the radius using our model with three uniform-temperature circular spots plus a modulated power law: the prior (dotted black line), the posterior after the completed pocomc run (green dashed line), the first 10% of the follow-up emcee run (red dotted–dashed line), and the final 10% of the follow-up emcee run (solid black line). The vertical axis is linear in the probability density. The colored tick marks rising from the radius axis near Re = 14 km show the medians of each of the probability distributions: 13.89 km for the pocomc run, 14.11 km for the first 10% of the emcee run, and 14.15 km for the last 10% of the emcee run. This figure reinforces the points made in Section 3.8.2: the pocomc sampling is broadly consistent with the later emcee sampling, although slightly narrower (see also J. U. Lange 2023), and the emcee run is well converged.
Other Images in This Article
Show More
Copyright and Terms & Conditions
© 2026. The Author(s). Published by the American Astronomical Society.