Image Details
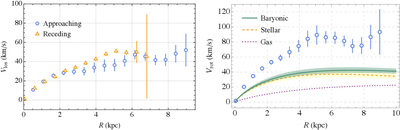
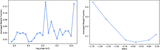
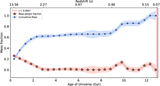
Caption: Figure B1.
Left: the line-of-sight velocity for the approaching and receding sides with R = 0 as the kinematical center. Right: the inclination-corrected mean rotation curve (blue circles with error bars). The plot also contains the stellar contribution to the circular velocity (dashed orange line, with mass uncertainty indicated in the yellow band), the estimated gas (H I and He) contribution (dotted purple curve), and the total baryonic contribution to the rotation curve (solid green curve) with uncertainty.
Other Images in This Article
Show More
Copyright and Terms & Conditions
© 2026. The Author(s). Published by the American Astronomical Society.
Copyright ©
2026 Astronomy Image Explorer. All Rights Reserved.