Image Details
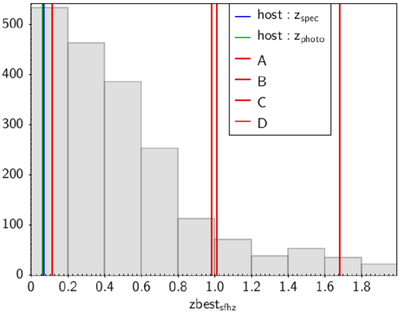
Caption: Figure A2.
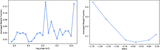
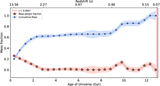
Histogram of the photometric redshift retrieved using the JWST photometry within z ≤ 2. Bins of 0.2 have been chosen to suggest the average size of redshift errors. The green and blue lines show the spectroscopic and photometric redshifts of the host galaxy, respectively. The red lines show the redshift of the four neighboring objects (see Figure A1 for the exact value of the redshift); only object D is consistent with being associated with the host galaxy, given the redshift errors.
Other Images in This Article
Show More
Copyright and Terms & Conditions
© 2026. The Author(s). Published by the American Astronomical Society.
Copyright ©
2026 Astronomy Image Explorer. All Rights Reserved.