Image Details

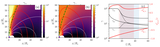
Caption: Figure 6.
Global model of radio emission from the magnetar magnetosphere. The radio-emitting zone is shaded in gray. The electrons and positrons experience a strong radiative drag, D± > 1, in the region bound by the black contours. The green curves highlight contours of γ⋆ = 10 and 20, sufficient for the production of powerful radio emission. The red curves are the contours of the emission frequency νem, which we take as comparable to the Doppler-boosted plasma frequency, ﹩{\gamma }_{* }^{1/2}{\nu }_{p}﹩. The blue curve shows the boundary of the region that can produce radiation capable of escaping through the outer magnetosphere (the optical depth to cyclotron absorption remains below unity along the escape path). In this calculation, we adopted ﹩{ \mathcal M }=50﹩.
Other Images in This Article
Copyright and Terms & Conditions
© 2025. The Author(s). Published by the American Astronomical Society.